Data-Driven Operations Improve ED Efficiency

- $1.2 million in additional revenue, the result of a 79.8 percent relative reduction in the left without being seen (LWBS) rate.
- 45.9 percent relative reduction in the time of patient arrival until first provider contact.
- 21.6 percent relative reduction in overall ED length of stay (LOS).
Emergency departments (ED) provide care for a staggering 145 million patients a year. Improving throughput times remains a top priority for hospitals as overcrowding and long wait times can lead to potential safety events and dissatisfaction with care. To improve ED throughput, Orlando Regional Medical Center (ORMC) assembled an improvement team to analyze the problem, utilizing data analytics and staff feedback to help identify a series of workflow changes designed to improve ED throughput and improve care delivery.
IMPROVING EMERGENCY DEPARTMENT THROUGHPUT REMAINS TOP PRIORITY
In the U.S., EDs provide care for over 145 million people annually, with 8.9 percent of ED visits resulting in hospital admission.1 As a result, overcrowding and long wait times often occur with increases in ED visit volume, leading to potential safety events and dissatisfaction with care.2
Like many high population areas, Orlando Health experiences a high volume of ED visits. Orlando Health is one of Florida’s most comprehensive private, not-for-profit healthcare networks, and is a healthcare leader for nearly two million Central Florida residents and 10,000 international visitors annually.
ORMC is Orlando Health’s flagship hospital and Central Florida’s only Level One Trauma Center; it is also a designated Stroke and Cardiac Center. ORMC provides care to over 100,000 patient visits annually and is equipped to handle any major or minor emergency. Improved patient experience and throughput time in the ED is a major priority for ORMC, because of the opportunity improvements present for better outcomes and cost savings.
LIMITED ACCESS TO ACTIONABLE DATA IMPEDES ED IMPROVEMENTS
As with many EDs across the nation, ORMC experienced increasing patient volumes while having a finite amount of resources to provide care. Subsequently, patients were waiting in the ED longer than desired, throughput times were not meeting internal goals or industry standards, and a number of patients were leaving without being seen.
Orlando Health has consistently sought to use data to support its improvement efforts, leveraging lean concepts to improve outcomes and reduce cost, yet limited access to actionable data hindered targeted improvement efforts. ORMC was aware of the impact of inefficiencies in internal processes for patient flow within the ED from the time of arrival until seen by a qualified provider. However, without insight into patient volume, arrival times, and throughput metrics, improvement efforts were often ineffective.
Leadership recognized that factors outside of the ED impacted throughput, including diagnostic testing turnaround times, room turnaround, patient transportation, and inpatient bed availability. A lack of actionable data negatively impacted collaboration with other departments, limiting the ability to develop improvement plans. ORMC understood that to impact ED throughput, it needed a data-driven collaborative culture and hospital-wide engagement.
DATA-DRIVEN ED IMPROVEMENTS
ORMC convened an interdisciplinary improvement team charged with developing a hospital-wide solution for improving ED throughput. The improvement team includes physicians and nurses from the ED, lean concept improvement specialists, data analysts, and representatives from radiology, laboratory, and environmental services.
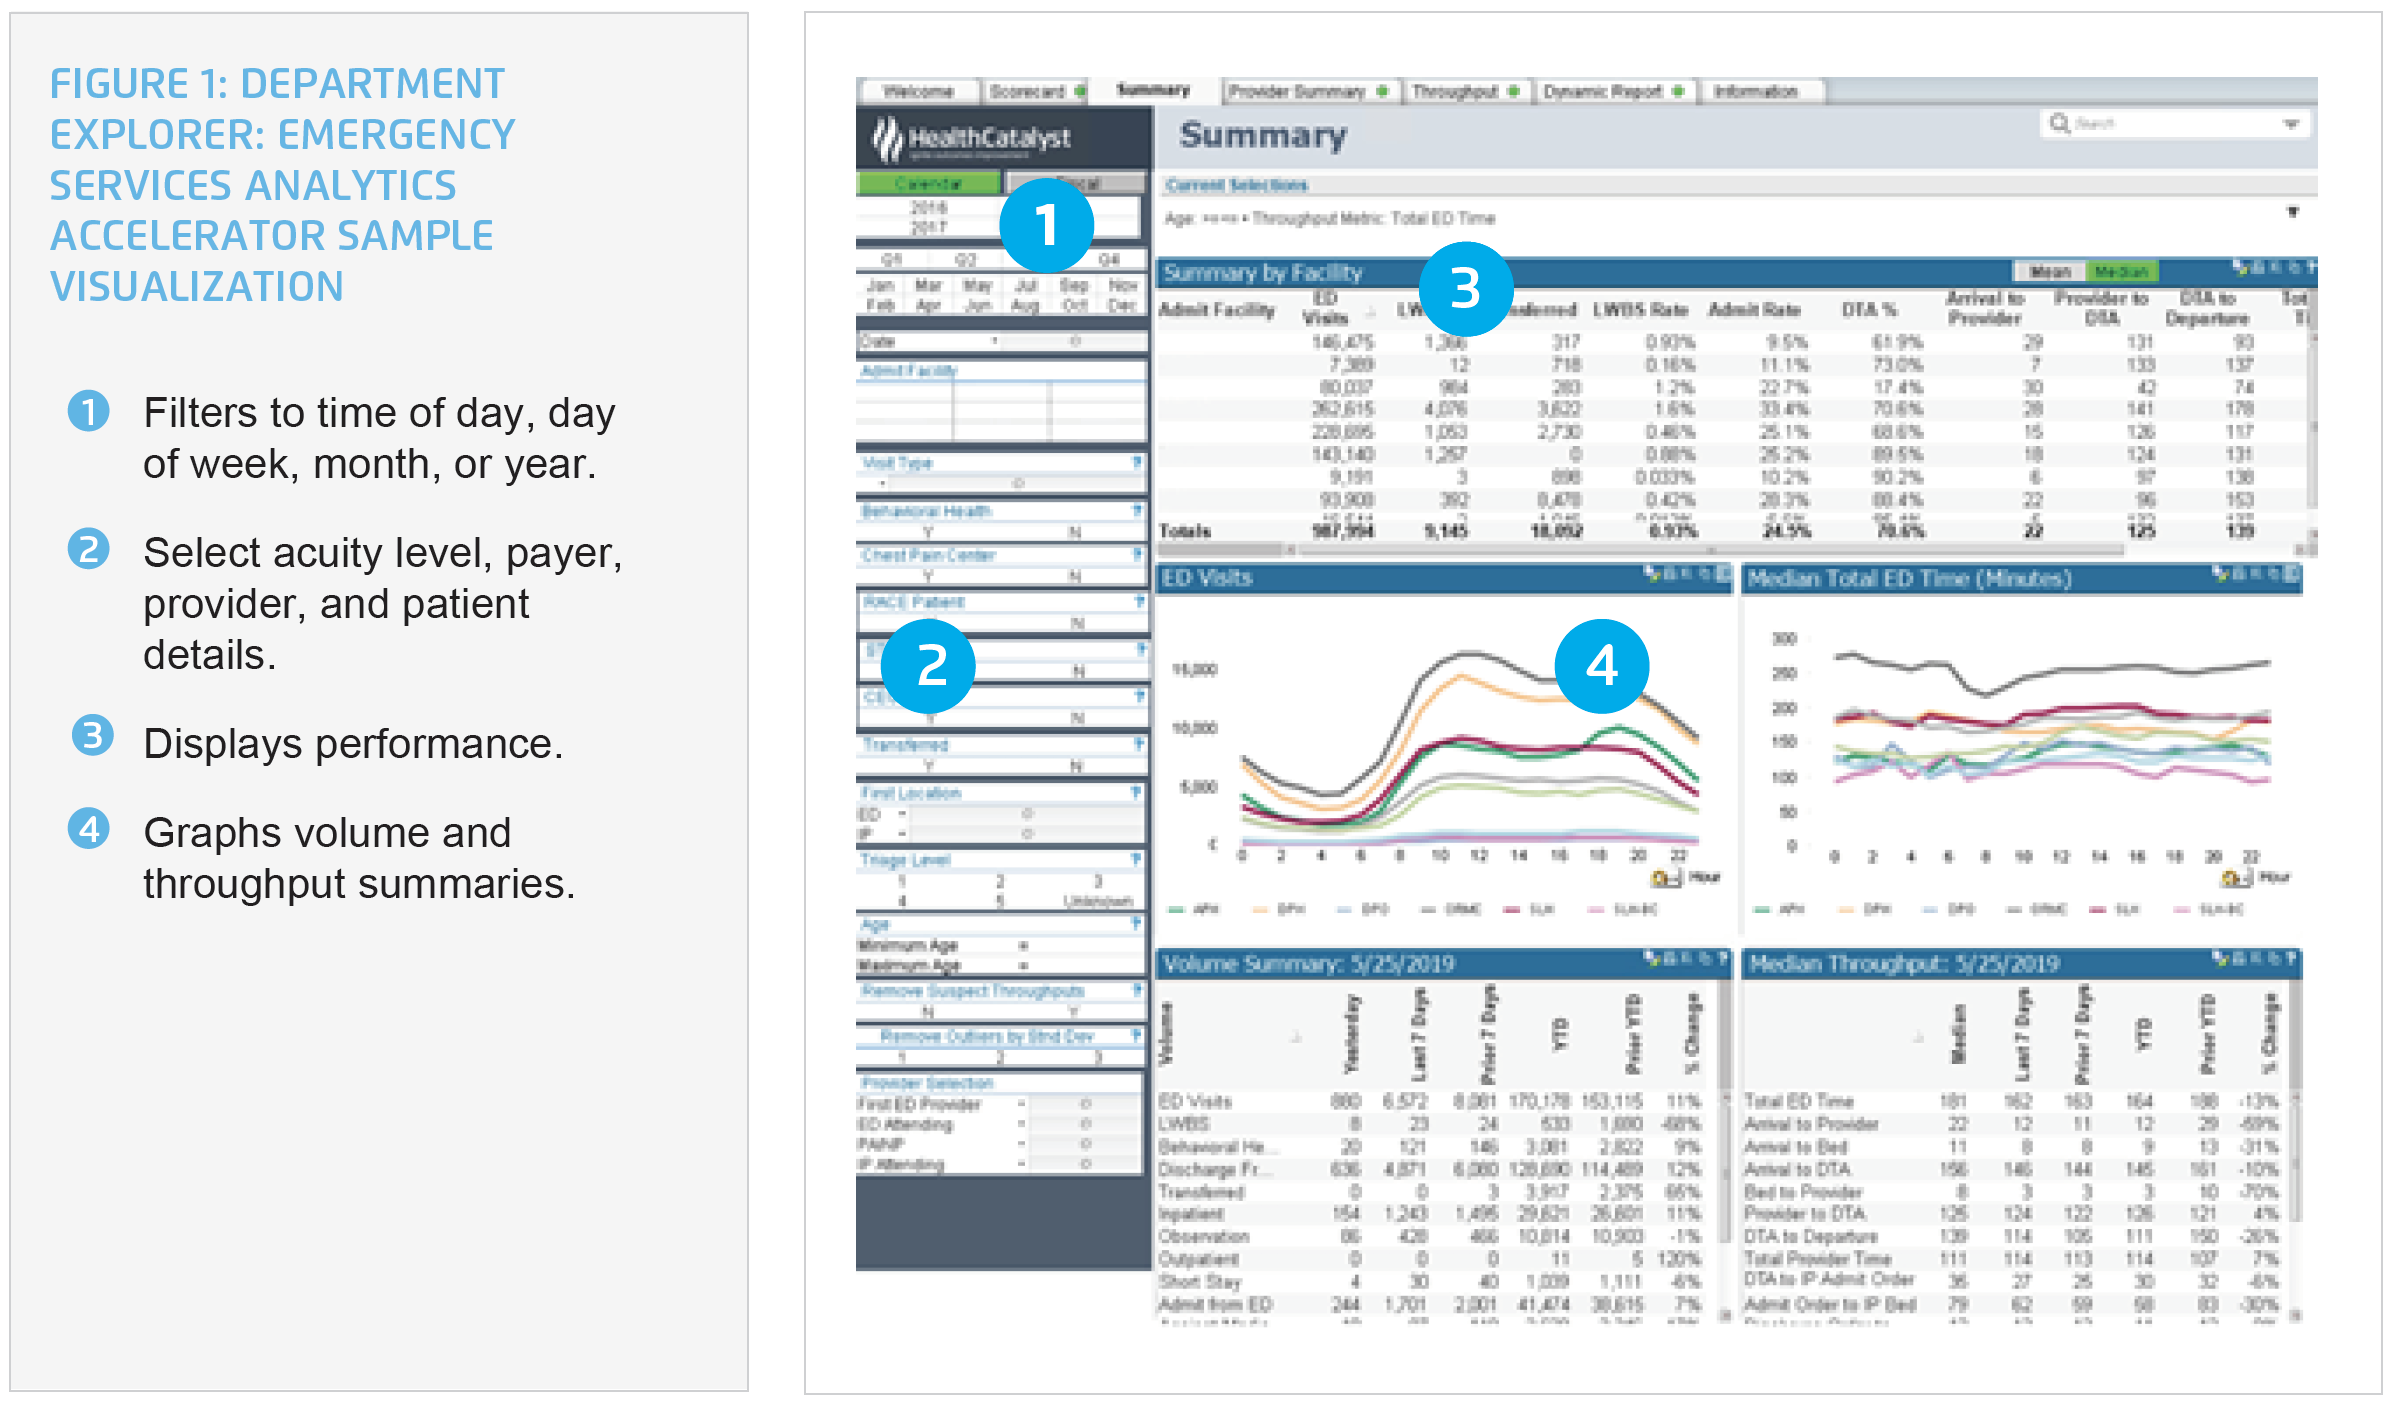
Orlando Health leverages the Health Catalyst® Data Operating System (DOS™) and a robust suite of analytics applications, including the Department Explorer: Emergency Services analytics accelerator, to provide sophisticated analytics, gaining insight into ED throughput data. The analytics accelerator provides near realtime visibility into performance. The visualizations include ED data, LWBS rates, time from arrival to provider, time from admission order to arrival to an inpatient bed, and time from discharge order to departure from the ED. Patient volume and arrival trends can be reviewed and compared by day, week, month, or year (see Figure 1).

ORMC used its new insights from the analytics accelerator to implement strategies across the continuum of care to improve ED throughput. In an effort to positively impact throughput time, ORMC implemented several changes.
Emergency department strategies
ORMC turned to its ED to identify opportunities for improvement from the source. Looking to its data for evidence and factoring in staff feedback, the following changes were made:
- Staffing an ED provider in the triage area. Using data to understand patient arrival patterns better, ORMC identified peak patient arrival times, and now staffs the triage area with an ED provider during those peak times, expediting patient evaluation.
- Adjustments to ED registered nurse staffing. This was done to better match patient arrival times.
- Ensuring open beds are filled. Patients are placed in an ED bed immediately upon arrival, if a bed is available, reducing the wait time for provider evaluation of the patient.
- Improving the timeliness of treatment when bed space is lacking. ORMC uses standard protocols to facilitate ordering of diagnostic tests, including labs and imaging, when there is not an ED bed available. A sub-waiting room was created for patients to use while waiting for the completion of diagnostic tests.
- Opening additional treatment locations during surges in patient volumes. ORMC identified additional patient treatment locations to use during surge periods, improving the timeliness and workflow of the provision of care.
Hospital-wide strategies
ORMC implemented a series of improvement changes throughout the hospital that were determined to have an effect on ED throughput and operations, such as:
- Ensuring timeliness of inpatient discharges. ORMC used its data to determine the time of day inpatients need to be discharged to prevent back-ups within the emergency departments, identifying 11:00 a.m. as the desired discharge time. Inpatient unit nursing staff identify patients with anticipated discharges for the next day, proactively helping the patient plan for and meet the 11:00 a.m. discharge goal.
- Ensuring timely turnover of dirty rooms. Environmental services members are notified of each discharge, and promptly arrive to the unit to clean and turnover the room.
- Proactively managing hospital occupancy. To ensure all staff is aware of current occupancy, and managing their work consistent with the demand, hospital occupancy is assigned a red, yellow, or green status. The status is distributed to staff every six-hours, who then use established plans to appropriately respond to the status.
Creating a culture of accountability
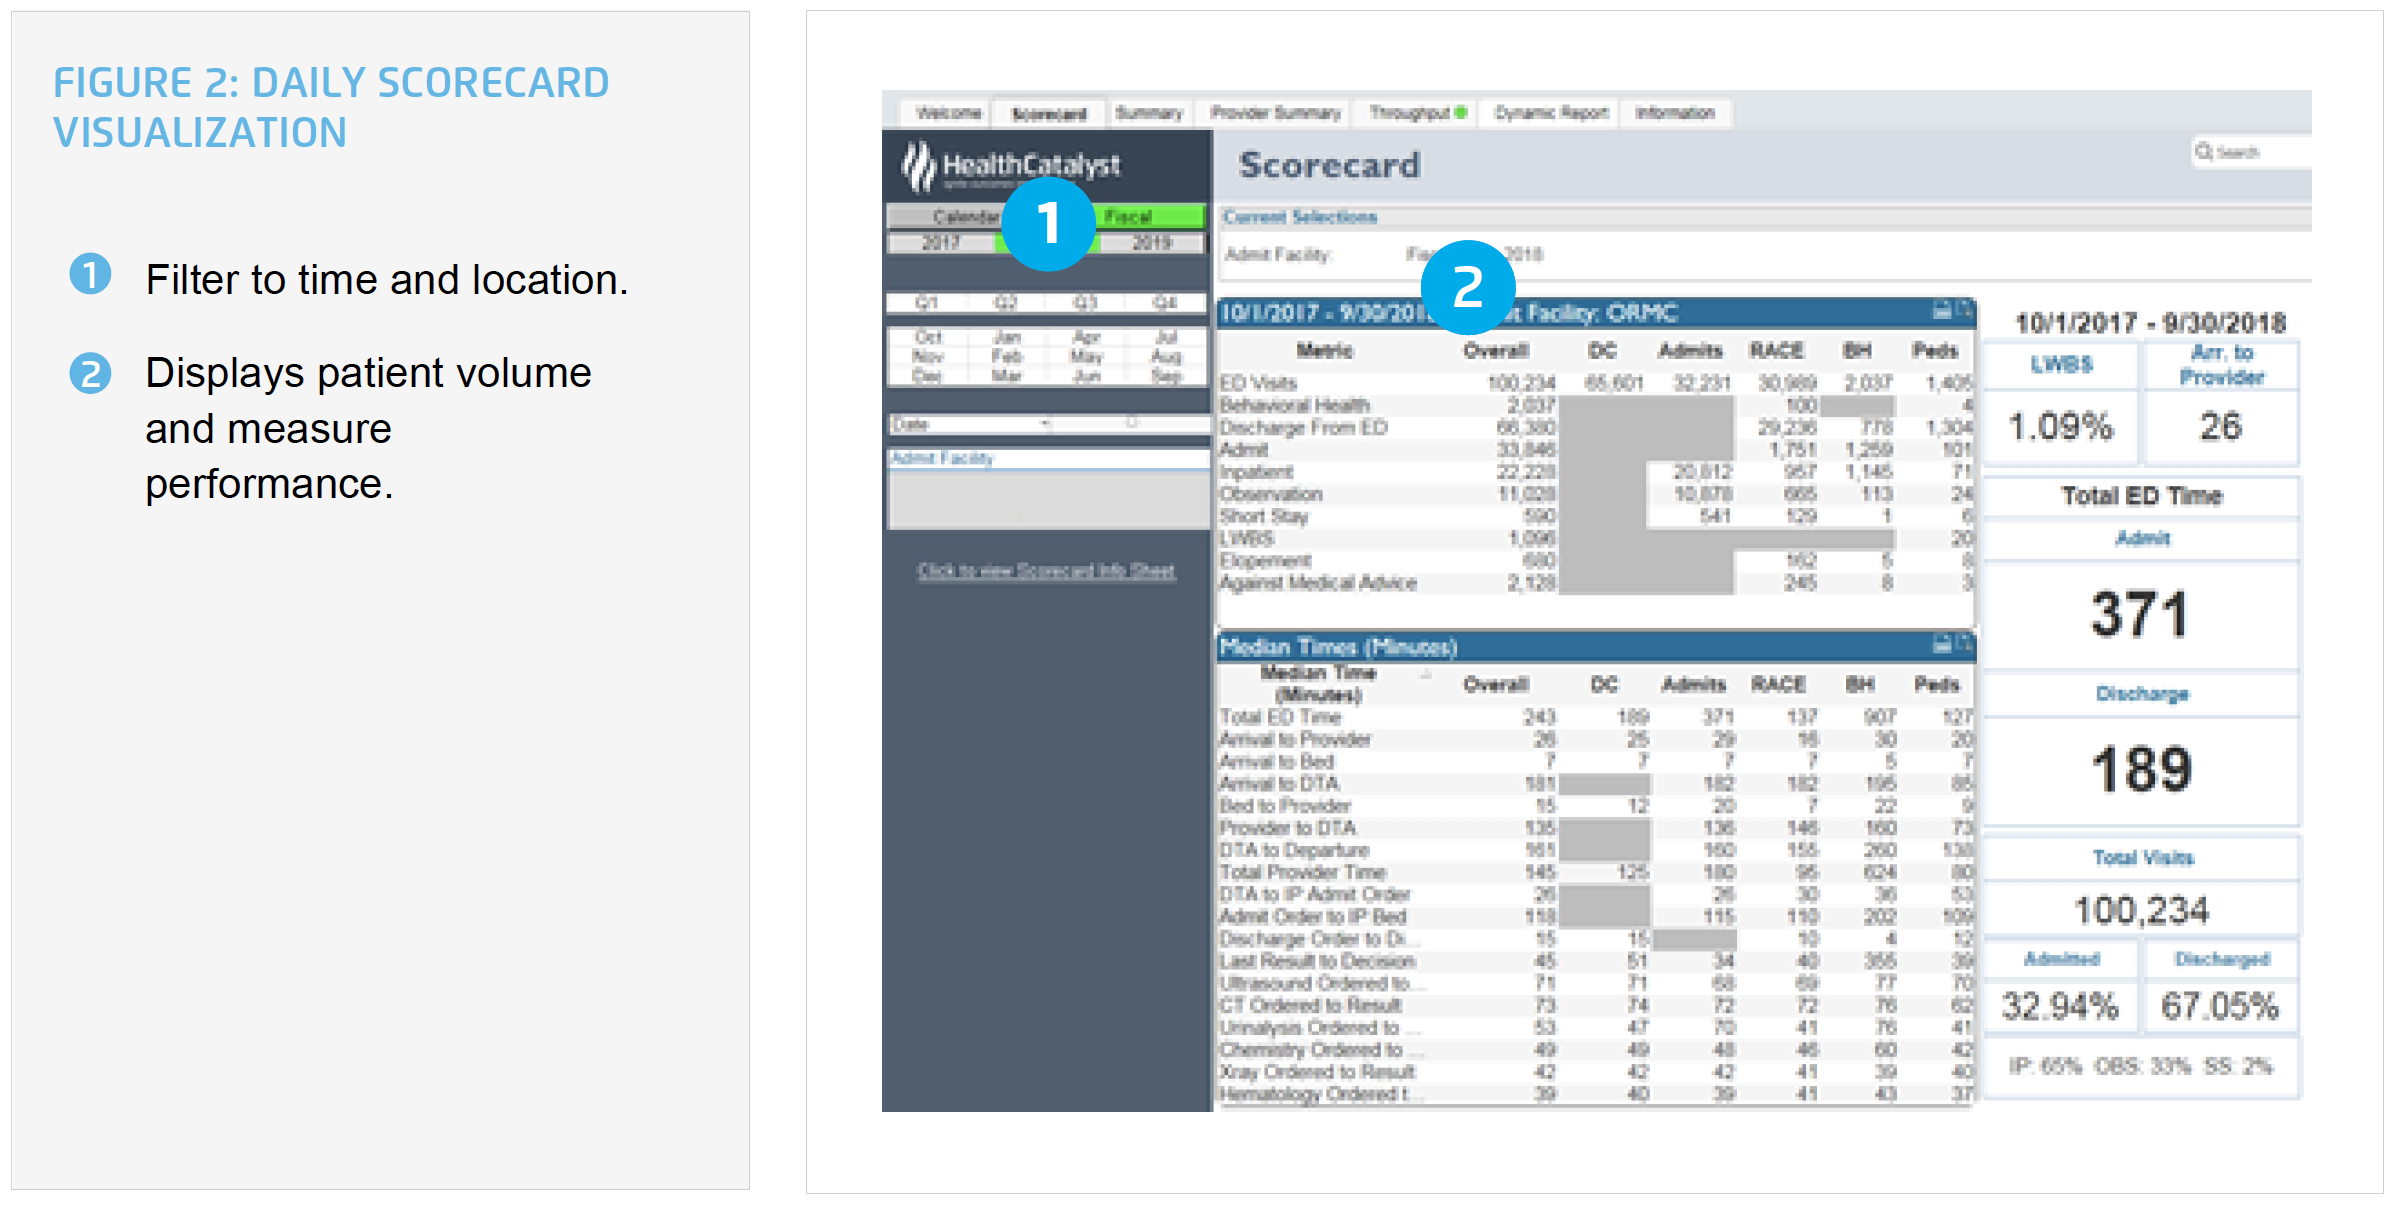
ORMC understands the importance of team member engagement for an initiative to succeed and the use of data to monitor performance. Leadership uses the analytics accelerator as a daily scorecard, fostering ownership of key performance indicators (see Figure 2). The vice president of operations leads a weekly operations huddle with stakeholders to review key performance metrics impacting ED throughput, including:
- Room turnover by environmental services.
- Results turnaround times for lab, cat scans, ultrasounds, and diagnostic imaging.
- Patient transportation times.
- Inpatient occupancy rates.
- Inpatient transfers to lower levels of care, LOS, and on-time discharge appointments.
- ED visit volume and throughput measures.

RESULTS
Using this collaborative, data-driven approach ORMC has achieved substantial improvements in ED throughput, including:
- $1.2 million in additional revenue, the result of a 79.8 percent relative reduction in LWBS rate.
- 45.9 percent relative reduction in the time of patient arrival until first provider contact.
- 21.6 percent relative reduction in overall ED LOS.
- 52.4 percent relative reduction in the time from admission order until the patient arrival to the inpatient bed.
- 22.2 percent relative reduction in the time from discharge order until the patient departure from the ED.
“We knew that we needed to engage hospital leaders to impact ED throughput to achieve our goal of providing the right care in the right place to improve the overall patient experience and quality of care.” – Louise Philp, MSHA, BSN, RN, CCRN-K, NEA-BC Administrator Patient Care Trauma, Neuroscience, and Emergency Services Orlando Regional Medical Center
WHAT’S NEXT
ORMC has established a culture of shared ownership for ED throughput. ORMC plans to further improve throughput by refining multidisciplinary rounds and improving case management for its complex patients.
REFERENCES
- Centers for Disease Control and Prevention. National Center for Health Statistics. (2017). Emergency department visits.
- Kamal, N., Barnard, D. K., Christenson, J., Innes, G., Aikman, P., Grafstein, E., & Marsden, J. R. (2014). Addressing emergency department overcrowding through a systems approach using big data research. Journal of Health & Medical Informatics. 5(1), 148.
This website stores data such as cookies to enable essential site functionality, as well as marketing, personalization, and analytics. By remaining on this website you indicate your consent. For more information please visit our Privacy Policy.