Analytics Improves Population Health and Drives Efficiencies

- 90 percent relative improvement inefficiency.
agilon health, an organization that partners with physician organizations in full risk contracts, needed a way to help its physician partners and care management staff quickly identify patients in danger of deteriorating health status and increased cost. However, taking a deeper look at the health status and costs associated with these patients was complicated by the slow manual review of data. By developing an analytics application, agilon health was able to turn its data into actionable insights, automate many manual processes, and ultimately provide targeted improvement interventions aimed at better care delivery.
TRANSFORMING CARE AND IMPROVING HEALTHCARE ANALYTICS EFFICIENCIES
Partnering with more than 13 provider organizations in 6 states, agilon health is passionate about improving the healthcare delivery system. The organization believes that—by enabling leading physician organizations with technology, proven processes, and human capital under global risk capitation models—it can transform care for patients and physicians alike. As part of its mission, agilon health is continuously seeking innovative ways to improve its overall efficiency.
UNDERSTANDING HEALTH STATUS AND COSTS WITH IMPROVED ANALYTICS EFFICIENCY
Per member per month (PMPM) costs for agilon health’s provider partners had continued to grow at unsustainable rates, making performance improvement within its risk contracts with payers difficult to impossible.
agilon health needed a mechanism to obtain an easy-to-use overview of members’ overall health and care utilization patterns, as well as insight into the prevalence of chronic conditions in specific member populations. This information would then assist in the identification of member cohorts whose conditions would be positively impacted by care management and overall population health interventions.
Information requests from agilon health’s provider partners presented its analytics department with a relatively high volume of tedious, manually intensive data querying and reporting requests, requiring a significant portion of the analysts’ time. Improving analytics efficiency would be necessary if agilon health wanted to improve the performance of its provider partners.
TIME-CONSUMING MANUAL QUERIES AUTOMATED WITH ANALYTICS
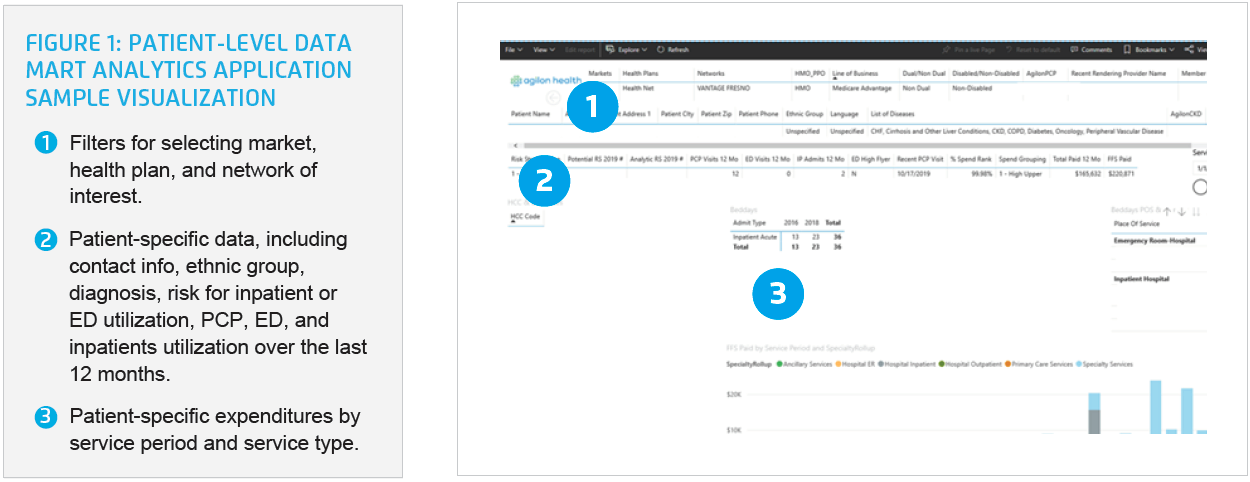
The solution for agilon health’s data and analytics needs was to leverage the Health Catalyst® Data Operating System (DOS™) platform and a robust suite of analytics applications, including artificial intelligence tools, to develop a Patient-Level Data Mart analytics application. The analytics application contains demographic data, utilization data, disease states, location information, and predictive risk scores for both inpatient and emergency department (ED) utilization for all currently attributed agilon health members.
Using the analytics application, agilon health can quickly and easily visualize data about a specific member population, break that data down further to examine a specific market, and then answer specific questions about that population as it relates to care delivery and utilization.
Because the analytics application offers the ability to visualize patient populations on both a large and small scale, agilon health can quickly and easily visualize the overall health, spend, and utilization patterns of individual members (see Figure 1).

Using the analytics application, agilon health can review 12-months of claims data for all active members within its various networks, and with that identify population-specific improvement opportunities, enabling the organization to develop and implement targeted strategies to improve population health. Some specific examples include:
- Improving Heart Failure (HF) Care Management – In the Hawaii market, agilon health provider partners used the analytics application to identify high ED and inpatient utilization among members with HF. The organization was able to adjust its care management services to ensure the proactive daily management of patients with HF, and ensure that members with HF are regularly scheduled to see their PCP and cardiologist.
- Managing End-Stage Renal Disease (ESRD) – agilon health identified the management of ESRD members as an additional area of opportunity within the Hawaii market. Using the analytics application, agilon health identified members with ESRD and deployed a program targeting those members who exceeded two hospital admissions within a year. It then enrolled these members in the ESRD care management program and scheduled regular PCP and nephrologist visits for each member.
- Improving Influenza Prevention – By using geographic mapping within the analytics application, agilon health identified members at high-risk for influenza who had not yet been vaccinated. The organization then engaged in targeted patient outreach, encouraging members to travel to a flu shot clinic nearest to their zip code.
The organization uses the analytics application and artificial intelligence to predict ED and inpatient utilization, identifying patients who are persistently high users. Care managers utilize this list to provide targeted care management interventions aimed at preventing the need for individual members to utilize emergency services.
agilon health uses the analytics application to identify provider partners with consistently negative margins who also have a significant number of members who are cost outliers. High- and rising-risk member reports are generated and reviewed with provider partners during outreach sessions. agilon health and its provider partners develop action plans to improve care and reduce costs.
RESULTS
agilon health’s analytics improvement efforts have positioned the organization to efficiently meet the reporting needs of its provider partners, arming them with the information needed to improve care delivery, and effectively address growing costs. The organization has achieved a:
- 90 percent relative improvement in analytics efficiency. agilon health’s analytics department is now able to focus on complex analyses that are more meaningful to the organization, advancing its ability to understand utilization so it can design and implement programs to contain escalating costs.
“Improving our analytics processes has enabled us to spend more time conducting complex, actionable analyses for our provider partners, arming them to more efficiently and effectively address care delivery and cost management concerns.”
– Lauren Polt, MA, Director of Clinical & Quality Analytics
WHAT’S NEXT
agilon health is expanding its predictive modeling capabilities to additional member populations and incorporating pharmacy, lab, and social determinants of health data.
This website stores data such as cookies to enable essential site functionality, as well as marketing, personalization, and analytics. By remaining on this website you indicate your consent. For more information please visit our Privacy Policy.